Using backscatter
A friendly tour of what you're looking at and how to drive it. Here's the whole thing at a glance:
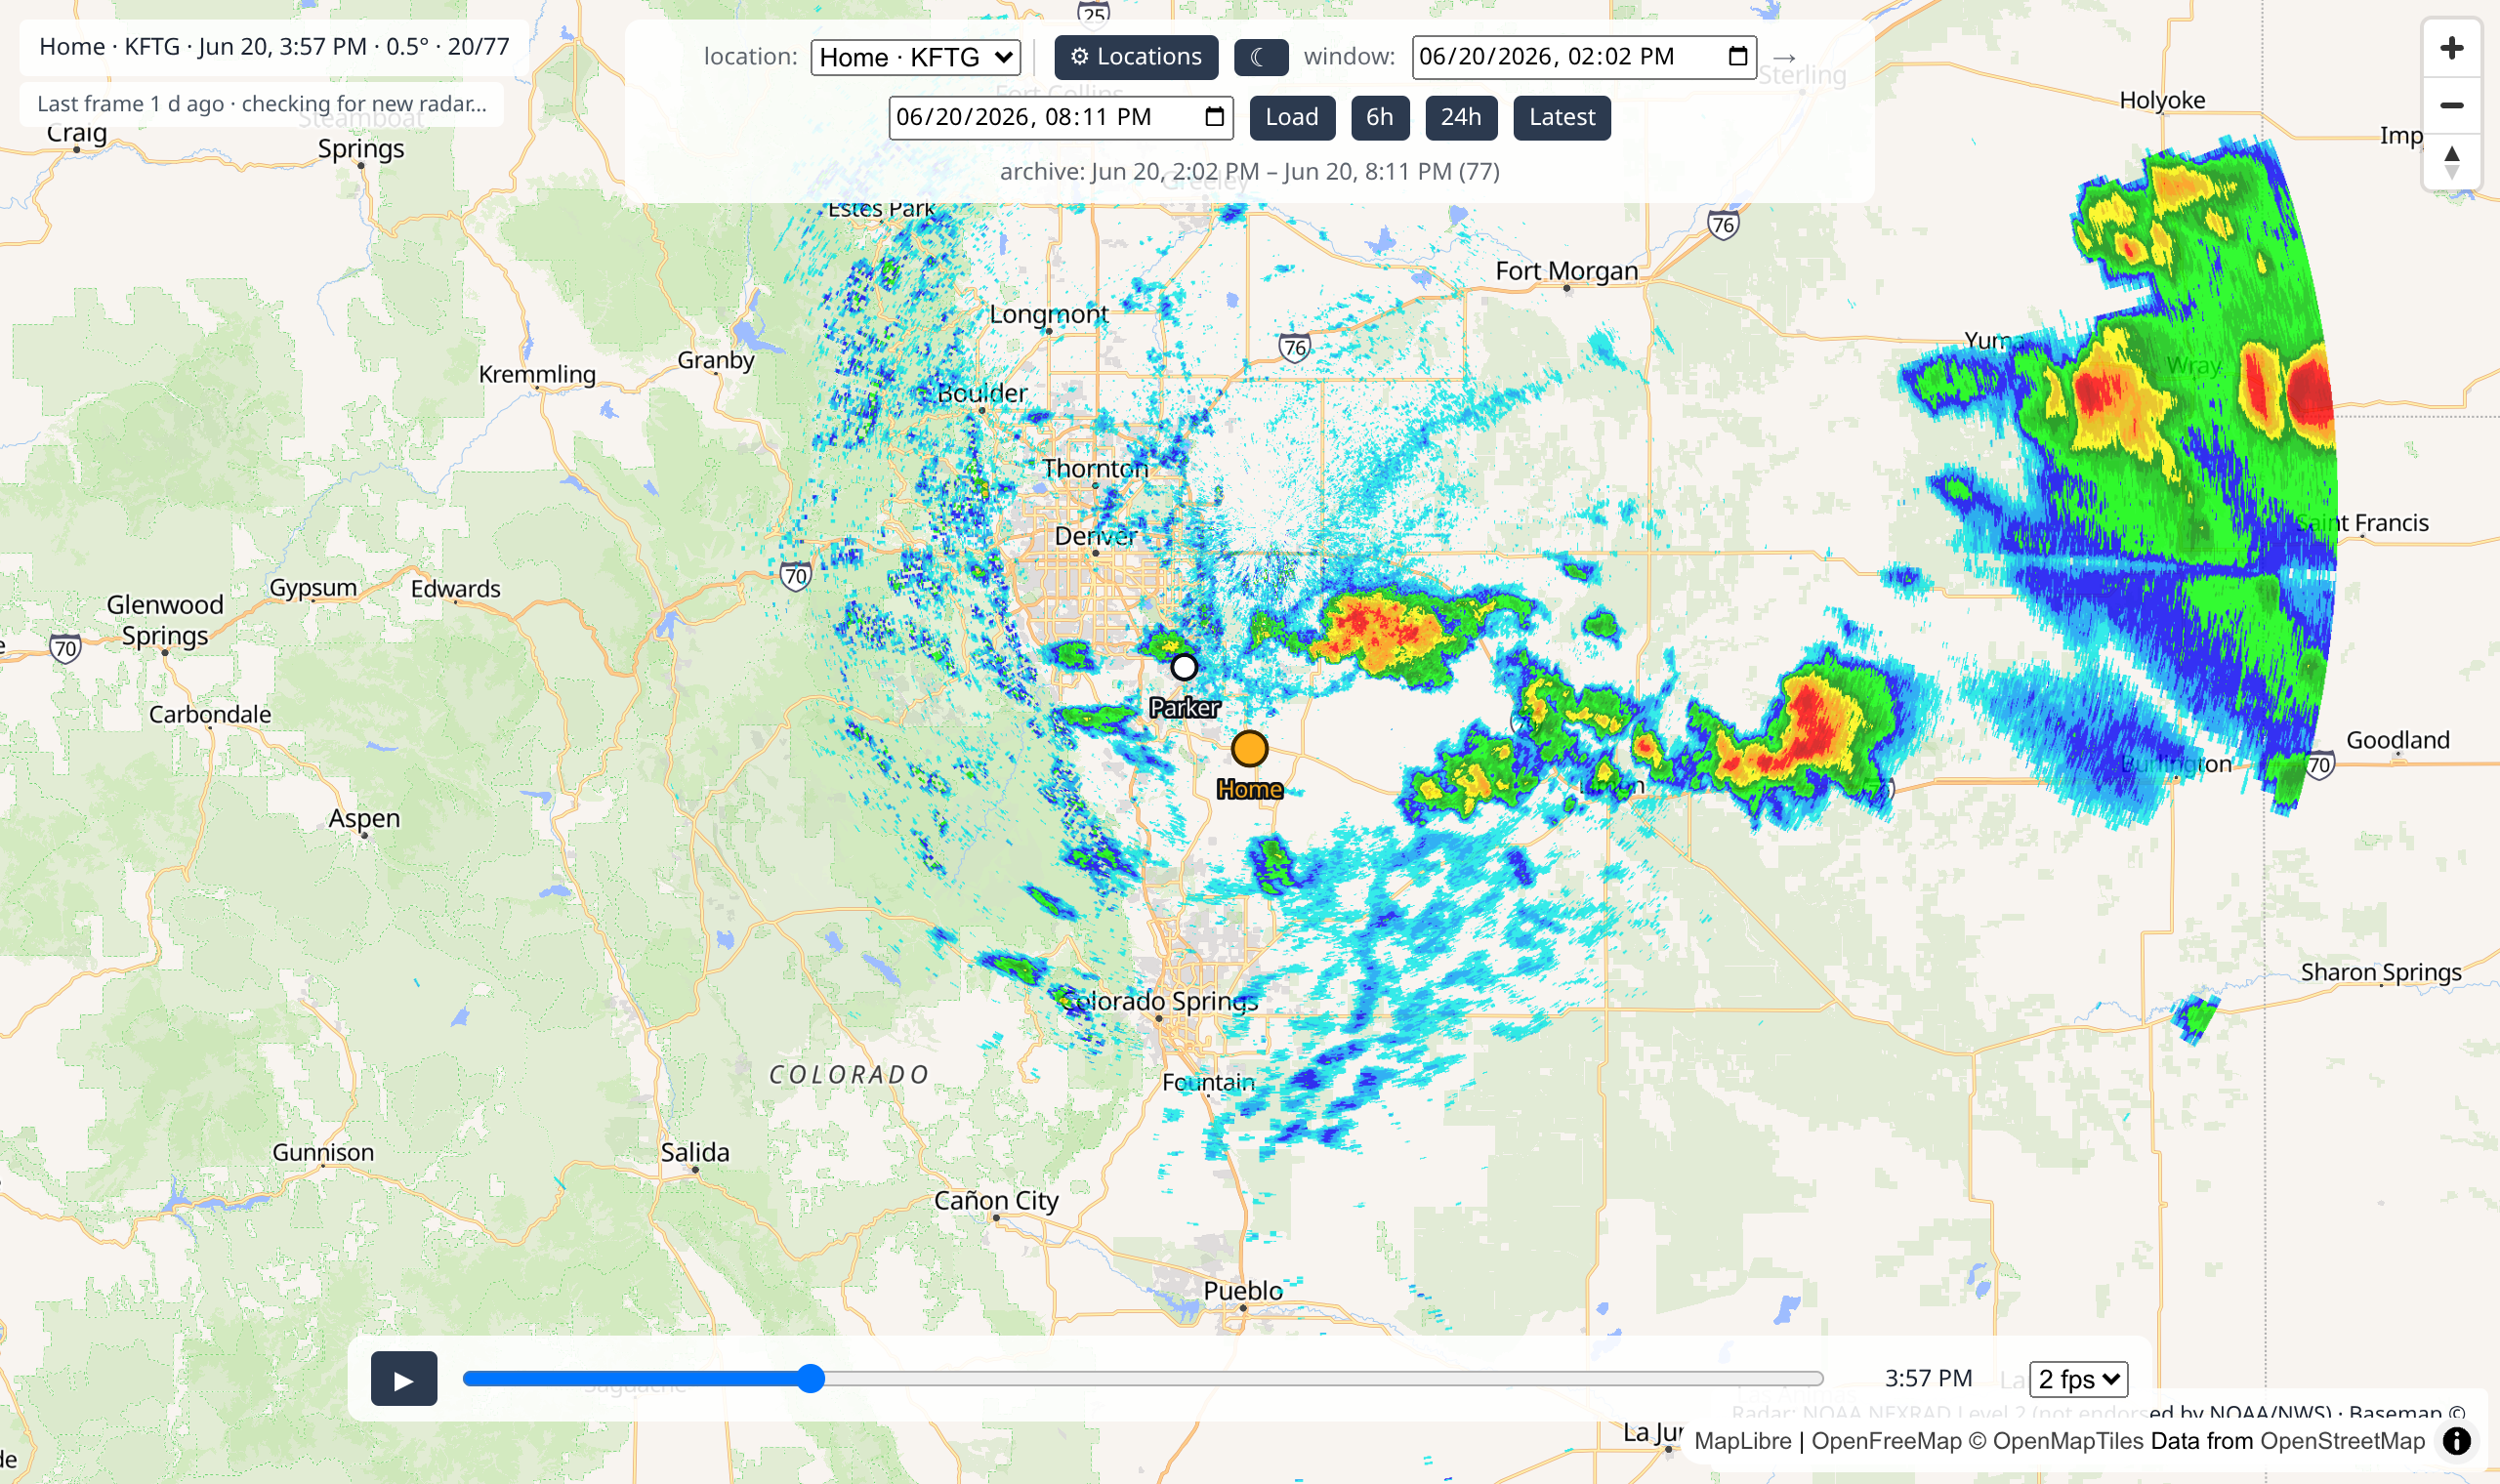
The map and the radar colors
The map works like any other — drag to move around, scroll (or pinch) to zoom in and out.
The colorful blobs are the radar. The colors show how heavy the rain or storm is, from light to intense:
- Light blue / blue — very light rain or drizzle.
- Green — steady rain.
- Yellow / orange — heavy rain, maybe a thunderstorm.
- Red / magenta — very intense: downpours, hail, strong storms.
Empty map means clear skies there — nothing to show.
Where the radar comes from
Each picture is real data from the nearest official U.S. weather-radar station, showing the lowest, most detailed sweep. backscatter doesn't alter it — same source the professionals use.
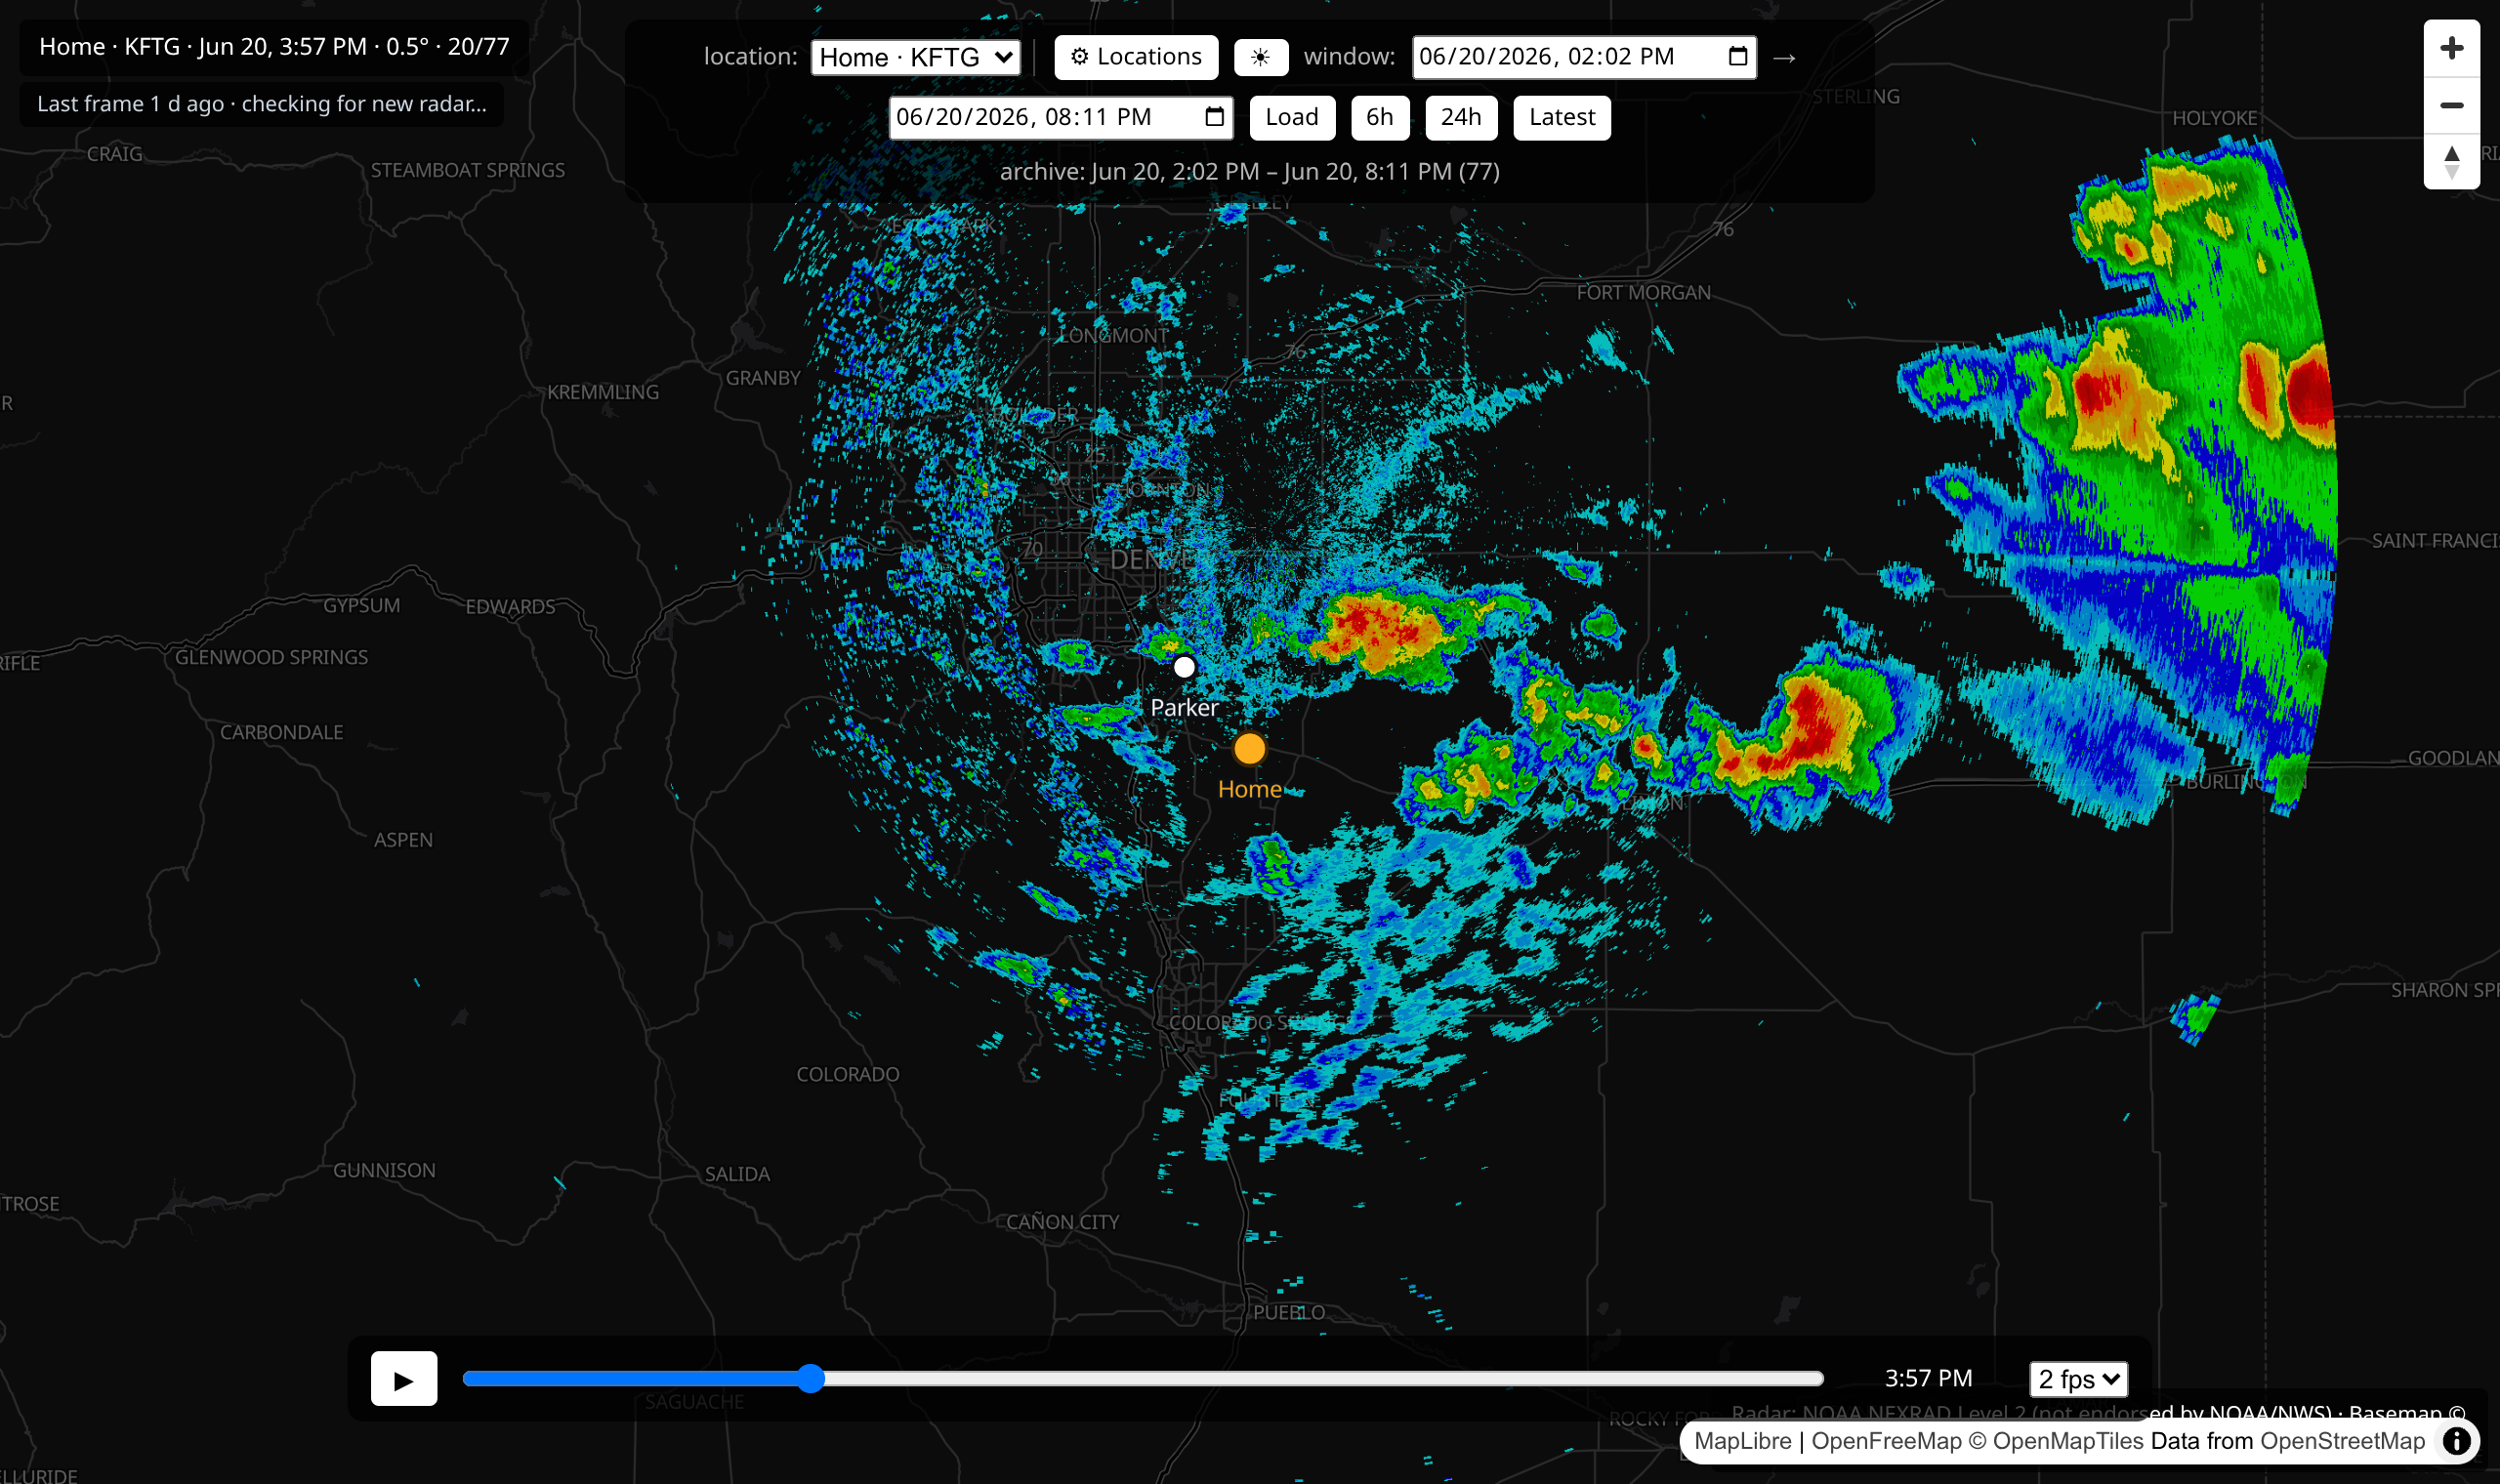
Light or dark
Use the ☀ / ☾ button in the top control bar to switch between light and dark mode — handy for night-time viewing. Your choice is remembered next time. Only the map and the controls change: the radar colors stay exactly the same in both themes, because they mean specific rain intensities (above), not decoration.
Make it look the way you like (the ⚙ button)
Click the ⚙ button in the top bar to open the settings panel. Near the bottom, under Display settings, are a few knobs that change how things look — none of them change the radar data, just how it's drawn:
- Map style — pick a different background map (plain, bright, dark, and more). All free, no account needed. Handy if the radar is hard to see over a busy map.
- Radar opacity — slide to make the radar more see-through, so you can read the town names and roads underneath, or more solid so the weather pops.
-
Palette — choose the colors used for rain intensity:
- NWS classic — the familiar green-to-red scheme the U.S. National Weather Service uses.
- RadarScope — the look you may know from the popular RadarScope app.
It's purely the coloring — the same data either way, just a different paint job. Pick whichever you find easier to read. - Hide clear-air — radar is so sensitive it also picks up bugs, dust, and the air itself on calm days, showing up as a faint speckly haze when there's no real weather. Tick this box to hide those very-light returns so actual rain and storms stand out.
Your choices are remembered for next time.
The readout (top-left)
The little panel in the top-left tells you exactly what you're looking at:

It shows your location, the radar station serving it, the date and time of
the picture on screen, the radar tilt angle, and which frame you're on (e.g. 30/33).
The timeline — play and rewind (the fun part)
Along the bottom is the timeline. This is what makes backscatter special: it's a DVR for the sky.
- Press ▶ to play — the radar animates forward so you can watch a storm move.
- Drag the slider to scrub to any moment — jump straight to last night's storm.
- The fps menu changes the playback speed.
Press play and watch it go:
Or grab the slider and sweep through history yourself:
Looking further back (the history bar)
The bar at the top lets you jump to any stretch of saved radar:
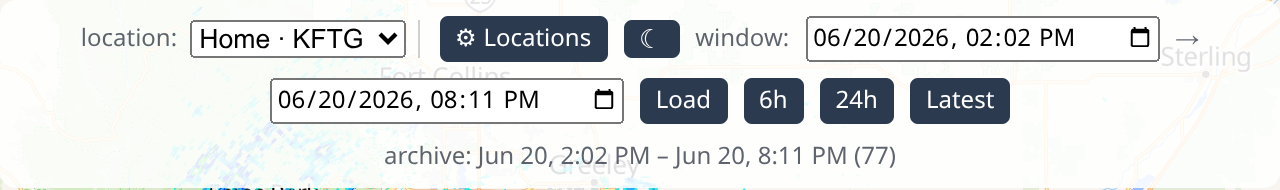
- The 6h and 24h buttons jump to the last 6 or 24 hours.
- Set a start and end date/time and click Load to pull up a specific window — great for "show me Tuesday's storm."
- Latest snaps back to the most recent radar.
How far back you can go depends on how long backscatter has been collecting (and your retention setting).
Switching between your locations
If you've added more than one place, a location dropdown appears at the top. Pick a different one and the map flies there and shows that town's radar:
Storm tracks (optional)
backscatter can spot individual storm cells and draw a little dot on each one with an arrow showing which way it looks to be heading and how fast. Turn it on under the ⚙ button → Display settings → Storm tracks. (It's off to start with, so the map stays uncluttered until you want it.)
The arrow length and the tick marks along it show roughly how far the storm might travel over the next half-hour — longer arrow, faster storm.
It's an educated guess — not a forecast
Storm tracks are estimated from how the storm has been moving, assuming it keeps going the same way. Real storms turn, grow, and fade. This is not a nowcast, not an official forecast, and not for any safety decision. For warnings and what-to-do guidance, always rely on the National Weather Service and NOAA Weather Radio. (See also Not for life-safety.)
Gap markers — "no data here"
backscatter only has radar for the times it was actually running. If it was switched off for a while, there's a gap — and it tells you, honestly, instead of pretending the storm jumped.
Gaps show up as amber striped patches on the timeline, and when you land just after one, a small "⚠ gap before" note appears with how long the gap was:

So if you ever see the radar "jump," the markers tell you whether that's a real fast- moving storm or just a stretch where nothing was collected. (Want to fill a gap? You can backfill it.)
That's the whole app! Anything not behaving? The Help & FAQ is next.